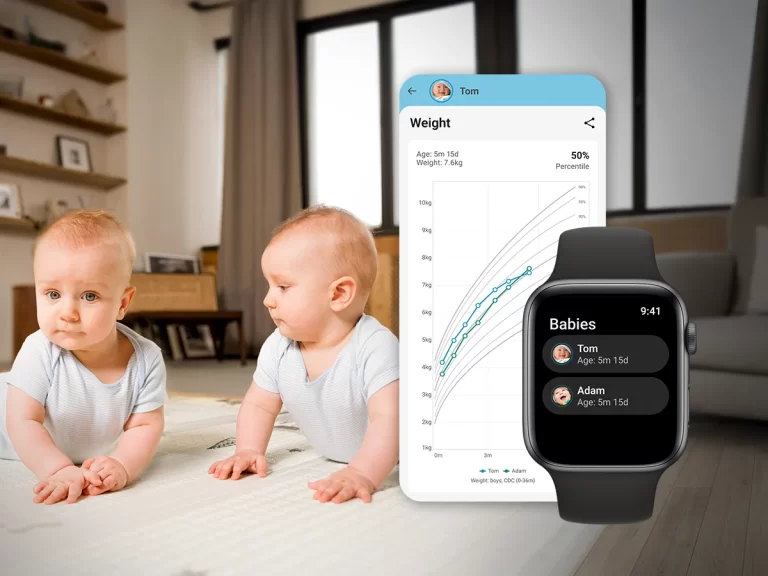

Baby growth charts help you and your baby’s healthcare professional follow changes in weight, length, and head circumference. Tracking your baby’s growth over time helps you see how those measurements change between checkups. But what does your baby’s weight percentile actually tell you? Is a higher number better, and what does it mean when a percentile changes? Here’s how to read baby growth charts and understand what those numbers can, and can’t, tell you.

What Do Growth Percentiles Mean?
On a weight-for-age chart, a percentile shows how your baby’s weight compares with babies of the same age and sex in the chart’s reference group.
Imagine lining up 100 babies by weight, from lightest to heaviest. A baby at the 25th percentile would weigh more than roughly 25 of them and less than roughly 75. It doesn’t mean your baby weighs 25% of what they should.
Length-for-age and head-circumference-for-age percentiles work the same way. You might also hear the word “centile.” In growth charts, it means the same thing as “percentile.”
It’s easy to see a number out of 100 and think higher must be better. But the 50th percentile simply marks the middle of the reference group. It isn’t a target every baby needs to reach.
A lower percentile doesn’t automatically mean something is wrong, and a higher one doesn’t automatically mean healthier growth. Babies at different percentiles can both be growing well. Your baby’s healthcare professional considers their earlier measurements, feeding, health, and family history to understand what the number means for them.
How to Read Your Baby’s Growth Chart
If you’re wondering how to read baby growth charts, start with your baby’s age and measurement. On most age-based charts, age runs along the bottom and the measurement runs up the side. The curved lines show percentiles, and your baby’s measurement appears as a dot where their age and size meet.
During infancy, healthcare professionals commonly record:
- Weight: how much your baby weighs.
- Length: how long they are when measured lying down.
- Head circumference: the measurement around their head.
There are also weight-for-length charts, which compare weight with body length. These help assess how a baby’s weight relates to their length, something a weight-for-age percentile alone cannot show.
Your baby might be on one percentile for weight and another for length. Those numbers don’t have to match exactly; their healthcare professional looks at them together.
Each new measurement adds another dot, showing how your baby has grown between appointments.
What If My Baby’s Percentile Changes?
Your baby’s measurements may move between percentile lines, especially during infancy. A change doesn’t automatically mean something is wrong, but it helps to look at it alongside earlier measurements and how your baby is doing.
A baby can gain weight and still move to a lower weight-for-age percentile if they’re gaining more slowly than the pattern shown on the chart.
Your baby’s healthcare professional reviews their growth at routine checkups. If the pattern changes, they may check a measurement again, ask about feeding or recent illness, and arrange a follow-up if needed. You can also ask about any change you’ve noticed in your baby’s records.
If you’re wondering about weight loss after birth and when babies regain it, our guide to early weight gain in babies covers the newborn weeks in more detail.
Why Are There Different Growth Charts?
You might notice WHO, CDC, or Fenton written beside a chart. These names refer to different growth standards or references, developed for different groups and purposes.
WHO growth standards describe growth under specified healthy conditions. In U.S. clinical practice, they’re recommended from birth to age 2, followed by CDC growth charts. Other countries may use different local chart systems.
Fenton charts are designed for monitoring babies born prematurely. If your baby was born early, your neonatal or pediatric team can explain which chart and age calculation they use.
There are also growth charts developed specifically for children with Down syndrome.
Different chart references can give different percentiles for the same measurement. If an app and your clinic show different results, check that the measurement, date, and chart reference match. Your healthcare professional can help you choose which reference to follow.
Tracking Your Baby’s Growth Between Checkups
Tracking your baby’s growth means keeping dated measurements together so you can look back at changes over time. It also makes the numbers easier to find when a question comes up.
In Baby Daybook, you can record weight, length or height, and head circumference, view growth charts, and add notes or photos alongside your entries.
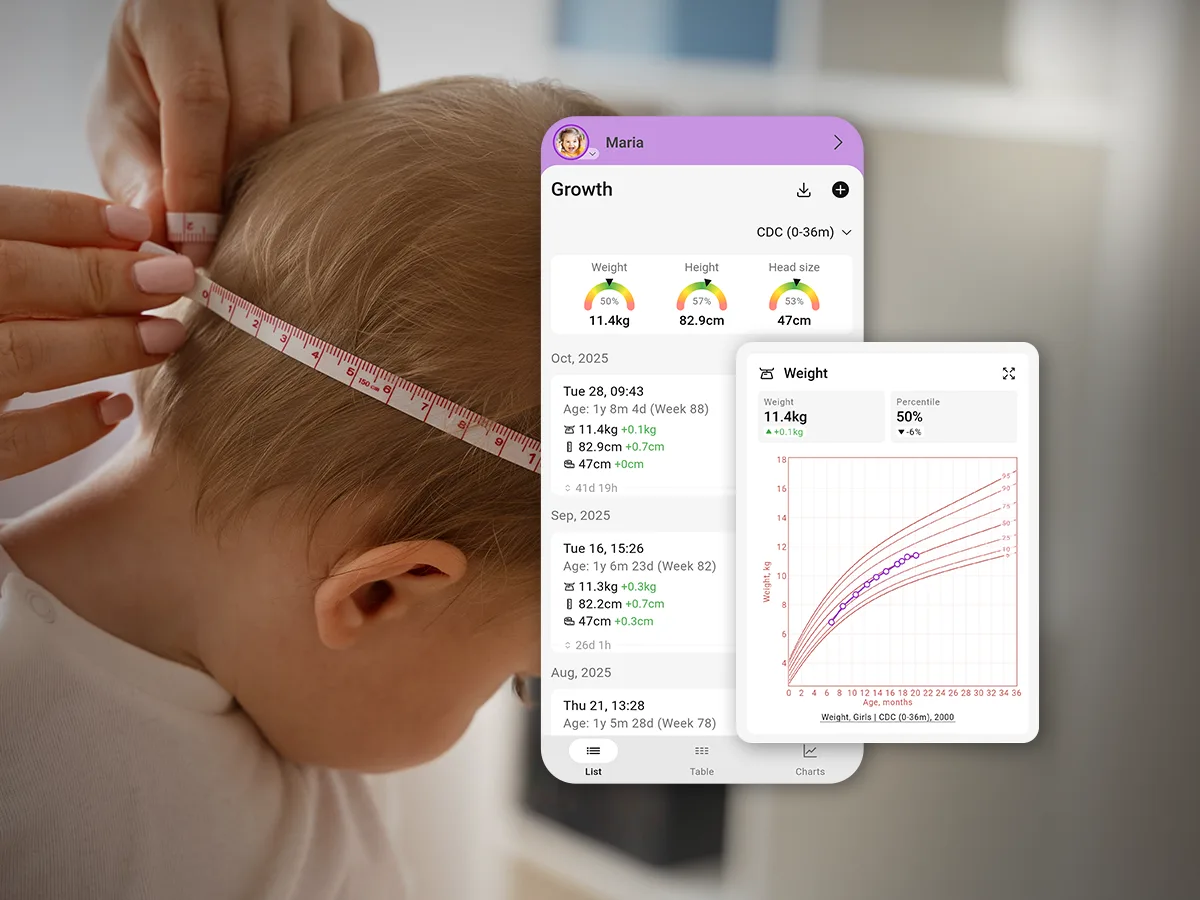
The app includes WHO and CDC charts, charts for children with Down syndrome, and Fenton charts for premature babies. Your baby’s healthcare professional can help you choose the reference that fits their care.
After a checkup, save the measurements with the date they were taken. You can also add note about any advice you received or when the next check is planned.
Keeping a growth record doesn’t mean adding extra weigh-ins. Follow your healthcare professional’s advice about when your baby should be measured.
Understanding Your Baby’s Growth Over Time
Knowing what percentiles mean can make your baby’s growth chart easier to understand. You don’t need to interpret every change yourself. At checkups, your baby’s healthcare professional can explain how the latest measurements fit with their growth so far.
A simple question can help: “What does this mean for my baby, and is there anything we need to do?” If you’re worried about feeding or your baby’s health between appointments, you can ask for advice sooner.
Frequently Asked Questions About Baby Growth Charts
What do growth chart percentiles mean?
On a weight-for-age chart, the 25th percentile means roughly 25% of babies of the same age and sex in the reference group weigh less and 75% weigh more. It’s a comparison, not a score.
How do I read my baby’s growth chart?
On an age-based chart, find your baby’s age along the bottom and their measurement up the side. Where they meet shows where the measurement falls among the percentile curves. Weight-for-length charts compare weight with length instead of age.
What is a normal percentile for a baby?
There isn’t one ideal percentile for every baby. The 50th percentile is the middle of the reference group, not a target. Your baby’s healthcare professional looks at their measurements, growth over time, and overall health together.
Should I worry if my baby drops percentiles?
A drop doesn’t automatically mean something is wrong. A baby can gain weight and still drop weight-for-age percentiles. Ask your healthcare professional about a noticeable or continuing change so they can review what’s happening.
How can I track my baby’s growth between checkups?
Tracking your baby’s growth between checkups can be as simple as saving the measurements from each appointment with the date they were taken. Baby Daybook lets you keep these entries together, view growth charts, and add notes. Follow your healthcare professional’s advice about when your baby needs to be measured.
This article provides general information and does not replace medical advice. Speak with your baby’s healthcare professional about their individual growth and feeding needs.
Sources
Anania, N. (2026). Understanding Growth Charts: A Parent’s Guide to Percentiles & Z-Scores. HealthyChildren.org. www.healthychildren.org
Centers for Disease Control and Prevention. (2024). Growth charts for children with Down syndrome. www.cdc.gov
Centers for Disease Control and Prevention. (2024). Using WHO growth standard charts. www.cdc.gov
National Health Service. (2023). Your baby’s weight and height. www.nhs.uk
University of Calgary. (n.d.). Fenton 2025 third generation preterm growth charts. www.ucalgary.ca